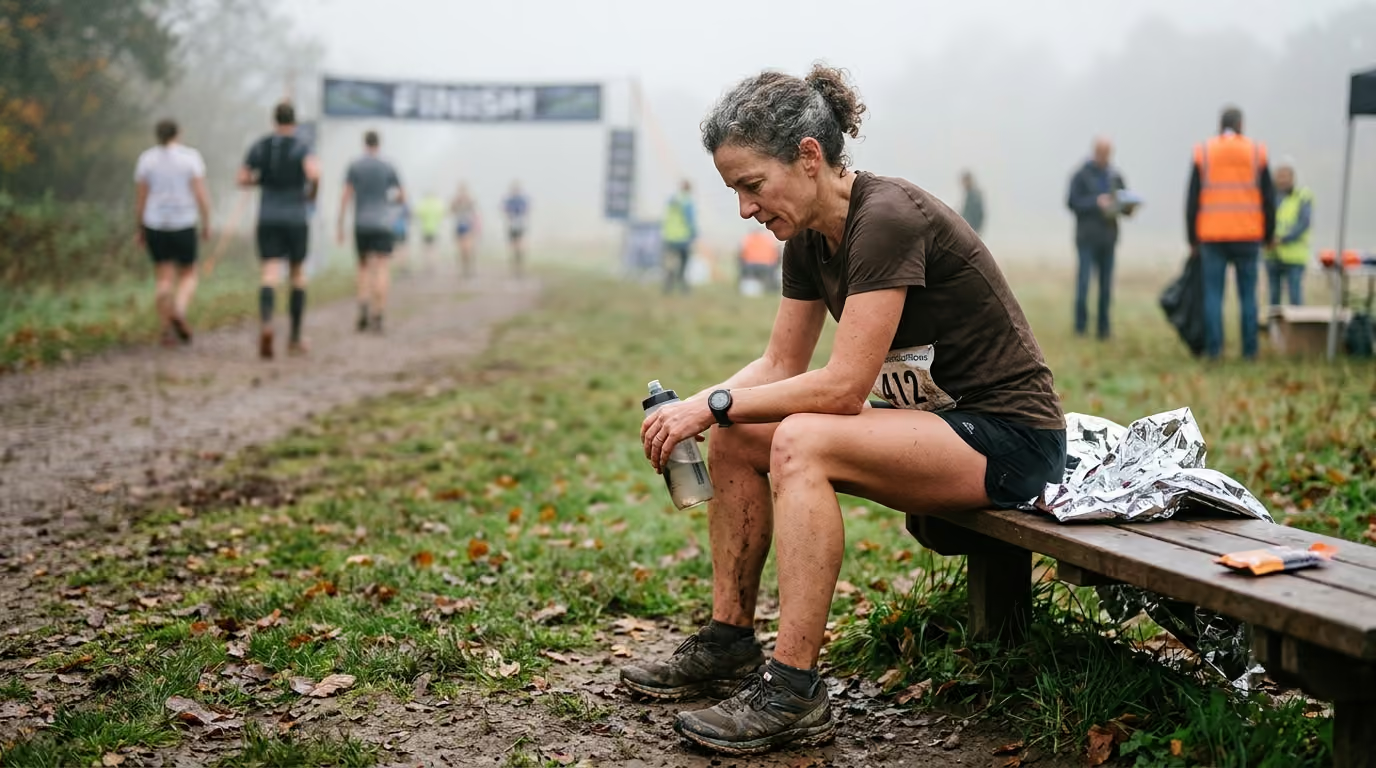

Post-race performance reviews help endurance athletes analyze pacing data, environmental conditions, and fueling execution to improve future training blocks.





A personal best time does not prove that your race execution was sound. Conversely, finishing several minutes behind your goal does not mean your training block failed.
Endurance athletes often treat finish times as definitive verdicts on their fitness. In reality, a finish time is merely one data point generated by a complex mix of physiology, weather, pacing decisions, equipment choices, and course topology. When you judge a race solely by the clock, you miss the actionable information hidden within your split files and telemetry.
Conducting a thorough post race performance review allows you to extract durable lessons from both strong days and difficult outings. Doing this correctly requires separating external outcomes from internal execution. It means looking beyond a single metric and asking what your data actually proves about your preparation.
Whether you are targeting competitive podiums or managing healthy athletic aging, learning to audit your race results systematically is one of the most effective habits you can build.
A finish time tells you what happened on the clock. It does not explain why it happened, nor does it tell you what to adjust in your next training cycle.
A race result is empirical evidence produced under unique conditions. Large-scale observational research on marathon data shows that environmental conditions significantly alter finishing times. For instance, in an analysis of more than 1.2 million New York City Marathon finishers, elevated ambient temperature was associated with an average finish time increase of approximately eight minutes across the field.
If you ran eight minutes slower on a hot day with steady pacing, your physiological output might match a personal best run in cool weather. Reducing that performance to a disappointment ignores the physics of heat dissipation and cardiovascular strain.
A proper review must answer three sequential questions:
Answering these questions requires separating outcome metrics from process metrics.
Outcome metrics describe the final product of your event. They include your official chip time, overall placing, age-group rank, qualifying status, and time behind the winner. Outcome metrics are affected by everyone else on the course, the weather, and the accuracy of the course layout.
Process metrics describe how you generated that result. They include your split distributions, pacing variability, power output, heart rate progression, cadence, fueling intake, and perceived exertion.
When planning your future training, process metrics must take priority over outcome metrics. A fast time achieved through an erratic, high-risk pacing strategy is rarely repeatable. A slower finish executed with strict discipline often provides a reliable baseline for future training breakthroughs.
Before opening your training logs, document the environmental and situational context of the event. Data without context will lead you to false conclusions.
Record the following variables:
Course measurement precision matters when calculating true pacing. World Athletics technical rules require that certified road courses be measured along the shortest possible route available to competitors. The measurement uncertainty for major international events must not exceed 0.1 percent, which equals roughly 42 meters over a marathon.
Your GPS watch measures distance by calculating discrete positional points. In ultramarathon and trail research, commercial GPS units demonstrated median distance errors between 0.6 percent and 1.9 percent, with significant variance based on tree cover and device quality. Furthermore, GPS units show greater measurement errors on non-linear courses with frequent turns than on straight paths.
If your watch shows 42.6 kilometers on an officially certified 42.195-kilometer course, calculate your true pace using the official timing mats. Use the GPS file to analyze effort distribution and segment behavior rather than claiming the course was measured long.
Pacing is the deliberate distribution of energetic resources across an athletic event. How you allocate energy across miles or kilometers reveals your tactical maturity and physiological conditioning.
A positive split occurs when the second half of an event takes longer than the first. A negative split occurs when the second half is completed faster than the first. An even split involves maintaining a stable speed across the entire duration.
Research across marathon cohorts consistently shows that faster finishers exhibit lower pacing variability than slower finishers. Top-tier runners tend to maintain steady speeds, while recreational fields display dramatic pace decay in the final third of the event.
Pacing profiles can be categorized into four primary real-world patterns:
This pattern is common in both running and cycling events. The athlete starts significantly faster than the planned goal pace, buoyed by the race taper and adrenaline.
Early heart rate and power figures drift above sustainable thresholds. By the halfway point, glycogen depletion, muscular damage, and thermal strain accumulate.
Pace begins to decline well before the final quarter of the race. Rating of perceived exertion rises rapidly to maximum levels, forcing the athlete to walk aid stations or coast descents. The primary lesson here is clear: the initial velocity exceeded physiological capacity for the day's conditions.
In this pattern, the athlete executes a disciplined opening section, keeping heart rate and power strictly capped. The second half is completed faster than the first, with perceived exertion rising gradually.
The athlete passes competitors continuously through the final miles. While this represents exceptional execution, a massive negative split can occasionally indicate excessive caution in the first half.
Analyses of large marathon datasets demonstrate that while extreme positive splits cause severe time losses, overly cautious openings can also prevent athletes from reaching their absolute time potential. If you finish feeling completely fresh with a large negative split, you likely had unused physiological capacity.
This pattern occurs when heart rate, power, or perceived exertion remain steady, but external speed gradually drops.
This often reflects external resistance factors, such as entering a headwind, hitting prolonged uphill grades, or rising ambient temperatures. It can also indicate localized neuromuscular fatigue where the metabolic cost of movement rises even though aerobic output is steady.
This scenario does not represent a tactical pacing mistake. It represents an environmental or neuromuscular ceiling that must be addressed through strength work or altered course-specific targets.
This profile is characterized by frequent, spiky surges and subsequent decelerations. It is common in road cycling, criteriums, cross-country running, and crowded mass-participation events.
Large differences between consecutive kilometers waste glycogen rapidly. Frequent accelerations demand anaerobic energy contributions, accelerating fatigue.
Unless the course terrain or tactical pack dynamics explicitly demand this variability, an erratic pacing file signals a need for improved effort discipline and spatial awareness.
Comparing only the first half of a race to the second half conceals critical details. A runner could execute an even half-marathon split by running the first ten kilometers at target pace, surging violently between kilometers 10 and 15, and completely collapsing from kilometer 18 to the finish.
Divide your race file into four equal quarters to diagnose where execution broke down:
For each quarter, examine the interaction between speed, internal load, and external effort. The most valuable post-race insight comes from identifying which variable changed first.
Review your segment data using these diagnostic rules:
When analyzing segments, filter out time spent completely stopped at aid stations or mechanical zones. Conflating stopped transition time with physiological deceleration will ruin your analysis.
To build an accurate assessment of your performance, avoid relying on any single data stream. Effective reviews use a triangulation model combining three distinct layers of data: external output, internal load, and subjective perception.
External output measures the mechanical work you produced, including pace, cycling power, and split times. Internal load reflects how hard your cardiovascular system worked to sustain that output, measured via heart rate. Subjective perception captures your central nervous system's integration of effort, measured via the Borg Rating of Perceived Exertion scale.
A finding is considered validated when at least two independent data streams point to the same physiological conclusion, and external context cannot provide an alternative explanation.
Consider these practical examples:
Heart rate is an internal response metric, not an absolute measure of athletic output. The American College of Sports Medicine highlights heart rate and perceived exertion as accessible ways to track intensity when direct laboratory oxygen testing is unavailable. However, heart rate is subject to numerous confounders.
Elevated ambient temperatures, caffeine intake, mental stress, and dehydration all increase heart rate independently of running speed or cycling power. Conversely, prolonged fatigue can suppress your maximum achievable heart rate during late-season events.
The American Heart Association notes that relying on age-predicted maximum heart rate formulas alone is severely limited when evaluating athletic strain. Never assume a higher average heart rate means you raced better. A high heart rate during a race often simply reflects high thermal strain or inadequate hydration.
For cyclists and multisport athletes, power meters measure external mechanical work directly. Key metrics include Average Power, Normalized Power, and the Variability Index.
The Variability Index is calculated by dividing Normalized Power by Average Power. A value close to 1.00 indicates an exceptionally steady effort, which is ideal for flat time trials and non-drafting triathlons. Higher values above 1.15 reflect spiky, surging efforts typical of criteriums and mountain biking.
Research evaluating Functional Threshold Power testing demonstrates that while standardized power testing is reliable, with typical measurement errors around 2.3 percent, threshold numbers alone do not explain race outcomes. Tactical efficiency often outweighs raw power.
In our experience auditing race files across our athlete community, we regularly see athletes produce massive power numbers while achieving mediocre finishes. Drafting in a cycling pack allows a rider to travel at high speeds with low power outputs.
If your average power was low but your placing was high, you executed a tactically brilliant race by conserving energy in the draft. If your normalized power was exceptionally high but you were dropped before the finish, you burned matches on non-decisive surges.
Finishing rank answers how you performed against the specific competitors who lined up on that exact day. It does not provide an absolute measurement of your physical capacity.
A podium finish in a regional race may reflect a weak competitive field rather than exceptional personal fitness. Conversely, finishing tenth in a highly competitive national championship might represent the best physical performance of your life.
To analyze placing accurately, use finishing percentiles alongside raw ranks:
$$\text{Percentile} = 100 \times \left(1 - \frac{\text{Place} - 1}{\text{Total Finishers} - 1}\right)$$
Tracking your percentile over time accounts for variations in total field sizes across different events.
World Athletics ranking systems assign different point values to placings based entirely on competition quality tiers. Recognize that placing is not directly interchangeable between local club races and championship events.
As we age, absolute maximum oxygen uptake and maximum heart rate experience natural physiological declines. For athletes over forty, age-group standings and age-grading percentages offer useful context for evaluating relative competitiveness.
World Masters Athletics age-grading tables compare your race time against an estimated standard for your age and sex. The formula evaluates your performance as a percentage of that standard:
$$\text{Age Grade Percentage} = \frac{\text{Standard Performance Time}}{\text{Athlete Performance Time}} \times 100$$
A score of 100 percent represents a performance matching the theoretical age standard. Scores above 80 percent typically reflect regional competitive level, while scores above 90 percent represent national-class caliber.
However, age grading must be interpreted with caution:
Use age grading as a broad benchmark to track your relative fitness trajectories over decades, not as absolute proof of physiological equivalence across different courses.
Master athletes face distinct physiological realities that change how race results should be reviewed. As we navigate masters racing, post-race analysis must account for changes in recovery rates, muscular resilience, and cardiovascular dynamics.
When auditing performances for athletes in their forties, fifties, and sixties, focus on these critical factors:
Maximum heart rate declines steadily with age, largely due to intrinsic changes in cardiac tissue and beta-adrenergic sensitivity. This means an older athlete racing at 160 beats per minute may be operating much closer to their maximum aerobic ceiling than a younger athlete at the same heart rate.
During race reviews, evaluate heart rate relative to your current, empirically tested maximum heart rate, rather than formulas based on age. If your heart rate plateaus early in an event despite rising perceived exertion, you may be experiencing autonomic fatigue or inadequate muscle glycogen availability.
Age-related reductions in muscle mass and tendon elasticity mean that downhill running and high-torque cycling efforts create greater muscular damage in older athletes.
If your cardiovascular data showed steady control but your pace collapsed late due to severe muscle soreness or cramping, the issue is eccentric durability rather than aerobic conditioning.
Your review should prompt additions of heavy resistance training and eccentric quad conditioning to your endurance training and performance plan rather than more aerobic volume.
Aging is associated with reduced sweat gland output and altered thirst sensitivity. Older endurance athletes often experience higher cardiac drift in hot and humid conditions compared to younger competitors.
When reviewing warm-weather race files, examine your hydration and electrolyte intake rigorously. Slower paces in the heat should be attributed to altered thermoregulation rather than sudden fitness declines.
To prevent emotional bias from distorting your conclusions, follow a standardized, repeatable protocol after every major event.
Immediately after finishing, or early the next morning, write out your subjective race account. Record your answers before viewing your GPS, power, or heart rate files:
Writing your impressions first preserves vital subjective data that electronic sensors cannot capture.
Inspect your recorded files for sensor dropouts, GPS drift, and cadence anomalies. Compare your watch file's elapsed time against the official chip time and gun time provided by the timing company.
If your watch shows significant discrepancies in distance, rely on official split mats positioned along the certified course to calculate accurate split paces.
Construct a sequential timeline of the race, marking critical milestones:
Under-fueling is one of the leading causes of late-race performance collapse in endurance sports. Compare your planned intake against what you actually consumed.
In our experience, athletes frequently underestimate the volume of carbohydrates required to sustain high-intensity efforts. For years, I capped my mid ride fueling at around sixty grams of carbs per hour, convinced that taking in more would wreck my stomach. Then I read a series of recent studies on gut training and higher oxidation limits for endurance athletes.
I spent a three month base phase gradually increasing my intake up to ninety grams using a mix of glucose and fructose. The difference during my next Gran Fondo was staggering. I had a late race surge that I had never experienced before, completely avoiding the usual energy crash.
When conducting your post-race audit, calculate your hourly carbohydrate and fluid intake. If your pace dropped in the final quarter and your intake fell below sixty grams of carbohydrates per hour, fueling failure is your primary suspect. Refine your strategy using evidence-based targeted fueling and hydration guidelines.
When an athlete slows down late in a race, they often focus entirely on the final miles. However, the final slowdown is merely the visible symptom of an error committed much earlier.
Trace your race file backward to find the root cause:
The earliest meaningful deviation from your plan is almost always the true cause of late-race fatigue.
Avoid treating every observation as an absolute certainty. Categorize your conclusions into three distinct tiers:
Only high-confidence and plausible findings should drive changes to your upcoming training cycles.
Convert your findings into one or two specific, measurable adjustments for your next block.
Avoid vague resolutions like "train harder" or "pace better." Create precise training experiments:
Athletes routinely fall into analytical traps that lead to misguided training adjustments. Watch for these common errors during your review process:
A personal best time can easily mask poor pacing. If you run a personal best while starting recklessly on a day with perfect temperatures, strong tailwinds, and a fast course, you succeeded because of favorable external factors.
Analyzing that file as a masterclass in pacing will encourage bad tactical habits in future structured racing events.
While massive positive splits signal poor pacing, a slight pace deceleration over the final miles of a marathon or long triathlon is physiologically normal.
Muscular fatigue, rising core temperature, and glycogen depletion inevitably degrade movement economy. A modest positive split of one to two percent on a challenging course can represent an exceptionally well-executed performance.
Athletes often finish a race with an aggressive sprint and conclude they paced too conservatively.
A fast finishing kick over the final two hundred meters does not prove you had vast untapped energy reserves. Research on competitive distance running shows that athletes often separate late by avoiding deceleration rather than producing dramatic acceleration.
The psychological presence of the finish line allows the brain to override central protective inhibition for a very brief duration. That brief burst cannot be extrapolated across several miles.
A race is a single performance sample gathered on one morning under specific conditions. Illness, hidden fatigue, emotional stress, and micro-climates all introduce variance into individual events.
Never overhaul your entire training philosophy based on one isolated result. Look for consistent trends across multiple events and training cycles before declaring a program effective or flawed.
To verify that your performance reviews are producing meaningful improvements, track a set of core longitudinal metrics across consecutive seasons.
Record these variables in an ongoing race audit archive:
Calculate the coefficient of variation for your splits across comparable events. A declining variability trend indicates improving tactical discipline and energy distribution.
Track the relationship between external output (pace or power) and internal strain (heart rate) across the second half of your events.
A decreasing rate of cardiovascular drift under similar environmental conditions demonstrates expanding aerobic base fitness and improved durability.
Monitor the number of positions you gain or lose in the final quarter of your races. Consistently moving up through the field in the final 25 percent of an event confirms robust pacing control and sound fueling.
Following each event, allow appropriate downtime and follow structured post-event recovery protocols before testing new physiological baselines. Sustainable improvement is built through patient, iterative refinements over years of training.
Approaching your race results with analytical objectivity transforms every finish line into a valuable source of training intelligence.

Follow ReEndure for practical insights on endurance training, recovery, nutrition and healthy aging. Stay connected for new articles, research led guidance and ideas to help you perform better for longer.


Read practical ideas on endurance training, recovery, nutrition and healthy aging to keep progressing for years to come.
Read the Blog