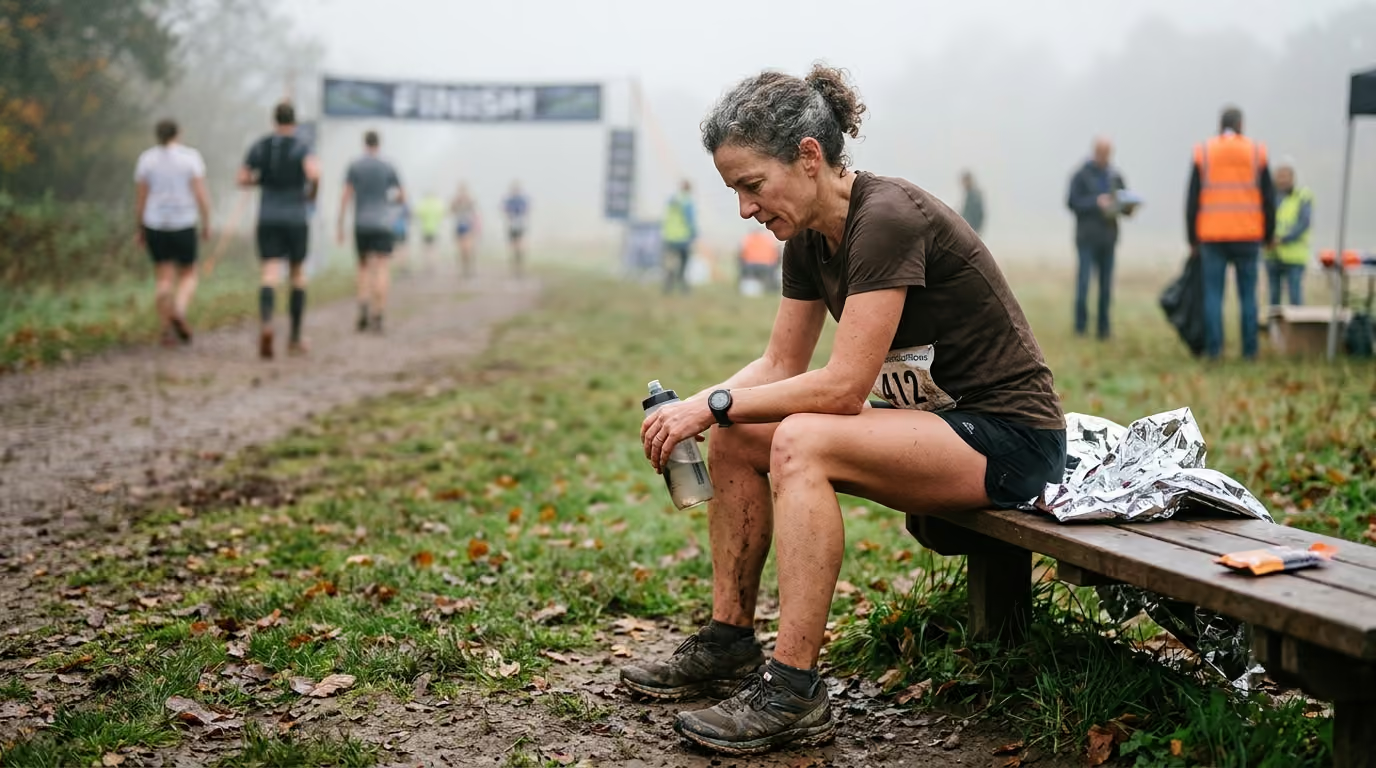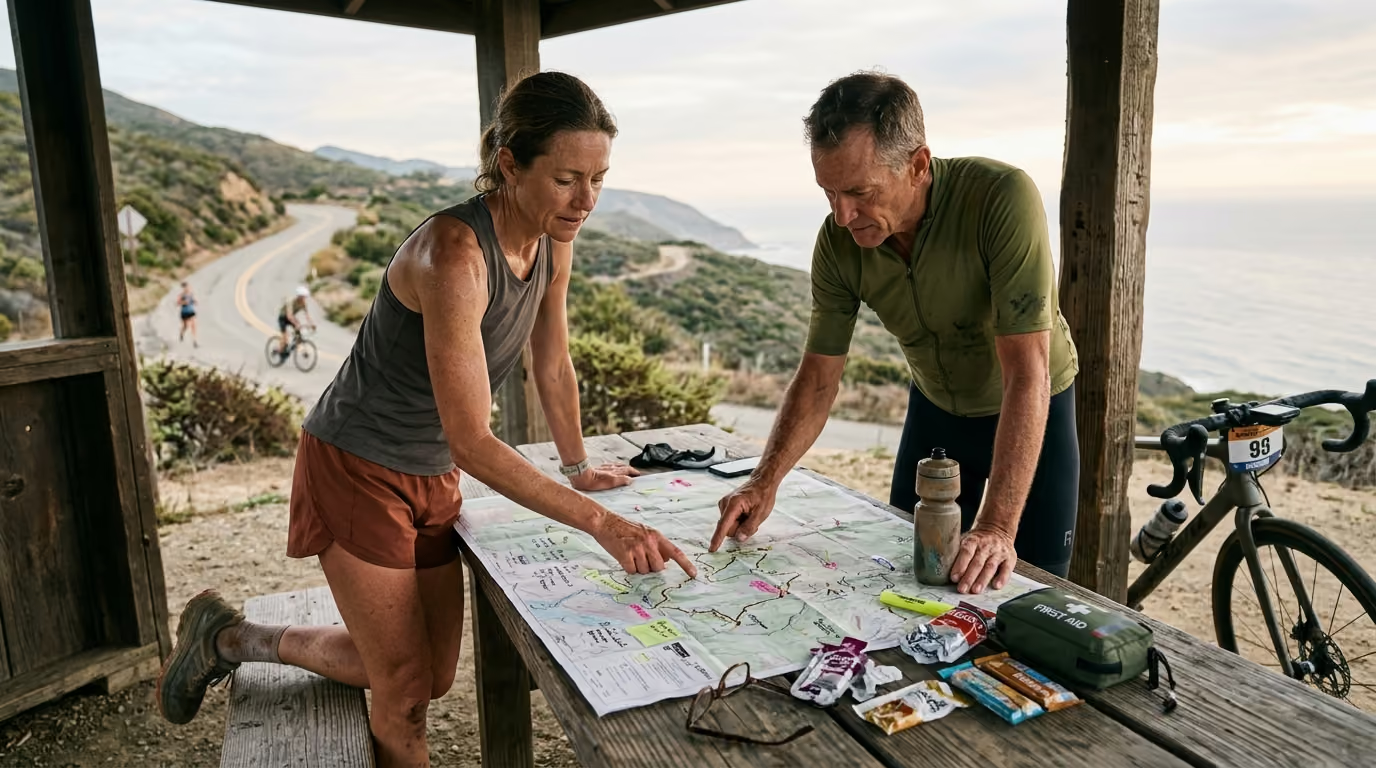

Course reconnaissance transforms topographic and surface data into an effective pacing plan that protects your glycogen stores and maximizes race performance.





How to study a race course map is one of the most common search queries among endurance athletes preparing for a target event. Most competitors download an elevation profile, glance at the total vertical gain, and memorize the locations of a few major climbs. On race day, they find themselves caught off guard by unexpected surface transitions, deceptive false flats, brutal downhill pounding, or poorly timed fueling opportunities.
Studying a course is far more than looking at distance and elevation. Course reconnaissance is the systematic process of breaking down an event route into manageable physiological and tactical problems. When you understand the specific biomechanical demands of every mile, you can build a pacing and nutrition strategy that maximizes your physical capabilities.
Consider a runner standing on the starting line of a hilly marathon. Their training block went smoothly, with twenty-mile long runs executed at target race pace on flat bike paths. The runner looks at the race elevation profile and sees a rolling course with several moderate climbs between miles five and fifteen, followed by a sustained downhill section into the finish.
The athlete commits to an even pace strategy based strictly on their flat-ground training metrics. During the early climbs, they push their heart rate high into threshold territory to maintain their goal speed on the ascents. By mile sixteen, their quadriceps are completely exhausted from absorbing the repetitive eccentric impact of the descents. The remaining miles devolve into a painful shuffle, resulting in a finishing time thirty minutes slower than their target.
Cyclists and triathletes frequently experience a similar breakdown. A cyclist might review an elevation map and prepare for an undulating gravel race, only to discover that the exposed ridgeline features sustained twenty-mile-per-hour crosswinds and loose washboard surfaces. By pacing purely to an arbitrary average speed rather than terrain-adjusted power output, they deplete their glycogen stores before reaching the final third of the course.
These failures rarely stem from inadequate cardiovascular fitness. They happen because the athlete treated the course map as a passive piece of information rather than a dynamic physiological blueprint. True reconnaissance bridges the gap between your fitness and the real constraints of the terrain.
The physiological cost of moving across uneven terrain does not follow a linear path. Research published by Alberto E. Minetti and colleagues in the Journal of Applied Physiology demonstrated that the metabolic cost of running increases dramatically on positive gradients, while the energetic savings on negative gradients plateau quickly. Running uphill requires significantly more metabolic energy per meter than flat running. Conversely, running downhill beyond a negative ten percent gradient fails to provide further energy savings while exponentially increasing mechanical load on your muscles.
When an athlete attempts to maintain a steady speed on an uphill segment, their rate of carbohydrate oxidation spikes. Intramuscular glycogen stores are finite, holding roughly 400 to 500 grams of energy in trained individuals. Surging on a climb burns through this premium fuel source at an unsustainable rate. Once those glycogen reserves are compromised early in a race, fat oxidation cannot supply energy quickly enough to sustain even a moderate pace.
Descending presents the opposite physiological challenge. While cardiovascular strain decreases when running downhill, eccentric muscle contractions increase dramatically. During eccentric contractions, your muscle fibers are forced to lengthen under load as they absorb impact forces up to three times your body weight. This process causes microscopic damage to the muscle sarcolemma and structural proteins.
In cycling, the physics of topographical management revolve around the relationship between speed and aerodynamic drag. As outlined by James C. Martin and colleagues in the Journal of Applied Biomechanics, aerodynamic resistance increases with the square of your velocity. Pushing excessive wattage into a steep headwind or on a flat descent produces diminishing returns in forward speed.
Investing higher power into steep climbs, where aerodynamic drag is minimal and gravitational resistance dominates, yields far greater time savings over the course of an entire race. Knowing exactly where the steepest grades occur allows you to budget your power output with precision.
You can learn more about managing these physiological trade-offs by exploring our endurance training resources designed for long-distance events.
Course reconnaissance must account for surface composition because different ground textures fundamentally alter your biomechanics and energetic efficiency. Running on smooth asphalt provides high energy return with every foot strike. Moving to loose gravel, mud, sand, or technical singletrack reduces that energy return significantly.
Studies in the Journal of Experimental Biology by Daniel P. Ferris and colleagues show that human legs adjust their mechanical stiffness when transitioning between surfaces. When running on compliant, soft surfaces like sand or thick mud, the leg spring becomes stiffer, requiring higher metabolic work from the hip and calf musculature to maintain propulsion. A trail race with identical distance and elevation to a road race can require twenty to thirty percent more total energy output depending on surface variability.
For cyclists, surface texture dictates rolling resistance. The coefficient of rolling resistance changes dramatically between smooth pavement, hardpacked dirt, coarse gravel, and rocky doubletrack. Riding on rough terrain causes high-frequency vibrations that transmit directly into the rider's body.
These vibrations lead to peripheral muscle fatigue and increased oxygen consumption as your stabilizing muscles contract to maintain balance. Selecting the correct tire casing, tread pattern, and tire pressure during course preparation directly reduces this parasitic energy loss.
Technical sections like exposed tree roots, rock gardens, and sharp switchbacks demand intense cognitive processing. When an athlete navigates technical terrain, their brain works overtime to process visual cues and execute rapid micro-adjustments in stride or bike handling. This elevated mental workload increases your Rating of Perceived Exertion even if your heart rate remains within an aerobic zone. Recognizing where these technical segments occur allows you to mentally brace for periods of high cognitive strain.
Many athletes plan their race nutrition strictly by the clock, deciding to consume a specific number of carbohydrates every twenty or thirty minutes. While this approach works well on predictable, flat courses, it often fails on complex terrain. Splanchnic blood flow, which supplies the gastrointestinal tract, decreases during high-intensity exercise as blood is redirected to working muscles.
If you attempt to swallow a concentrated carbohydrate gel while working at ninety percent of your maximum heart rate on a steep climb, you increase your risk of nausea, cramping, and delayed gastric emptying. Nutrition intake must be synchronized with the topography of the course. The ideal moments for fueling are flat segments, slight downhills, or protected tailwind sections where your heart rate is controlled and mechanical jarring is minimized.
Reconnaissance also informs your fluid carrying strategy. Carrying extra fluid adds dead weight that increases the energy cost of climbing. One liter of water weighs exactly one kilogram. Carrying two full bottles up a five-mile mountain pass costs measurable wattage and physical effort over the duration of an ascent.
By mapping the precise mileage between official aid stations, you can carry only the fluid necessary to reach the next refill point safely. You should calculate your expected transit time between stations rather than relying on pure distance. A five-mile gap across a technical mountain ridge might take you seventy-five minutes, whereas a five-mile gap on a paved descent might take twenty minutes. Planning by transit duration ensures you never run out of fluids or carry unnecessary mass.
Our comprehensive guides in the nutrition and fueling section outline exact hourly intake targets for varying race conditions.
Every race course contains hidden features that can disrupt your rhythm or tempt you into catastrophic tactical errors. Identifying these chokepoints and pacing traps in advance allows you to navigate them with composure.
The first two miles of nearly every endurance event present a major pacing hazard. Adrenaline, crowded fields, and cheering spectators create an artificial sense of ease. If the course begins with a wide downhill road, the field will naturally surge at speeds well above sustainable race pace.
Checking the elevation of the first three miles helps you establish a strict ceiling on your effort. Committing to an exact heart rate or power cap prevents you from being swept up in the collective excitement of the pack.
In trail running, mountain biking, and gravel racing, wide roads often funnel rapidly into narrow singletrack. If you enter a technical singletrack section trapped behind a long line of slower athletes, your pace will drop significantly. Conversely, if you surge into the red zone to reach the trail entry first, you risk blowing through valuable glycogen reserves in the opening minutes of the event.
Reconnaissance reveals exactly where these bottlenecks occur. You can decide in advance whether the tactical benefit of positioning yourself near the front of the singletrack entrance justifies the energetic cost of a short opening effort.
False flats are subtle uphill grades ranging from one to three percent that appear visually flat to the naked eye. Athletes often fail to recognize the grade and attempt to maintain their flat-ground speed, unknowingly driving their effort into an unsustainable anaerobic zone.
Headwind corridors create an identical trap. When a route turns directly into an open, exposed valley, your speed will plummet despite maintaining steady power. Expecting these velocity drops prevents the psychological frustration that often causes athletes to surge aggressively into headwind resistance.
Understanding these course elements is a core part of developing effective racing and events strategies that withstand unpredictable race conditions.
Samuele Marcora's psychobiological model of endurance performance illustrates that exhaustion is largely determined by perceived exertion rather than pure muscular failure. When unexpected course obstacles arise, such as an unmapped hill or a confusing intersection, perceived exertion climbs rapidly. Pre-race route analysis removes surprise from the equation, preserving mental bandwidth and maintaining athletic composure across hours of competition.
Translating a race map into an actionable operational plan requires a systematic, four-stage reconnaissance process. This structured workflow transforms raw geographical data into concrete execution targets.
Begin by obtaining the official GPX file directly from the event organizer. Upload the file into dedicated mapping and analysis software such as VeloViewer, CalTopo, or Strava. Do not rely solely on the simple elevation graphic provided on the race website, as those summaries often smooth out critical short, steep rollers.
Break the total course elevation profile down into distinct segments:
Switch your mapping software to satellite view to analyze the environmental surroundings of the course. Look for canopy cover, open agricultural plains, exposed alpine ridges, and urban asphalt corridors.
Identify potential microclimates along the route. A valley floor may be freezing cold and damp at sunrise, while an exposed ridgeline ten miles later may feature blazing direct sunlight and dry heat. Street view tools can help you examine the quality of the road surface, the width of the shoulders, and the radius of tight downhill switchbacks.
If you live within driving distance of the race venue, conduct targeted physical reconnaissance during your training block. It is rarely necessary or practical to run or ride the entire course in a single training session. Instead, prioritize the most critical twenty to thirty percent of the route.
Focus your physical scouting on two key areas:
When physical inspection is impossible due to travel constraints, watch first-person course preview videos online. Many athletes upload uncut helmet-camera or chest-mount footage of popular races. Watching these videos allows you to visualize the exact turns, surface changes, and landmark cues you will encounter.
Convert your digital and visual analysis into a simple, durable cue card that you can reference during the race. Cyclists can tape a laminated strip to their top tube or stem, while runners can wear a printed wristband or carry a laminated card in their pocket.
Review our dedicated training and performance articles to learn how to structure your training blocks to match these course-specific demands.
Age-related physiological shifts require athletes over forty and fifty to approach course strategy with greater intentionality. While cardiovascular capacity can be preserved at high levels through consistent training, changes in musculoskeletal properties and recovery kinetics alter how the body responds to specific course stresses.
As we age, our tendons and connective tissues experience alterations in collagen architecture. Tendons become less compliant, reducing their natural ability to absorb and return elastic strain energy. This change places higher mechanical stress directly on skeletal muscle fibers during downhill running.
Master runners must treat downhill course sections with extreme caution. Charging aggressively down early descents can cause severe structural muscle damage that prematurely ends a race. Master athletes should focus on increasing their downhill cadence, taking shorter, lighter strides to minimize braking forces and protect the quadriceps from excessive micro-tears.
Pupillary responsiveness and visual contrast sensitivity naturally decline over time. For trail runners and gravel cyclists participating in events that start before dawn or extend into the night, navigating technical terrain becomes significantly more demanding.
Reconnaissance helps you identify where technical singletrack or rough gravel coincides with low-light hours. Upgrading your lighting systems, selecting high-contrast lens tints for your eyewear, and memorizing hazardous trail features are vital safety strategies for older competitors.
The autonomic nervous system's ability to regulate body temperature shifts with age. Sweating response can become slightly delayed, and cutaneous blood flow during high heat stress may be reduced.
Master athletes must analyze the environmental exposure of a course with extra care. If a route features long, unshaded climbs in the afternoon heat, plan active cooling strategies well in advance. Utilizing ice bandanas, dousing your head with cold water at aid stations, and maintaining consistent sodium replacement prevents heat-induced performance declines.
Our specialized resources on healthy aging in endurance sports offer comprehensive guidance on adapting training for long-term athletic durability.
Even experienced endurance athletes frequently make strategic mistakes when translating a course map into a race day plan. Recognizing these common errors ensures your reconnaissance leads to a successful outcome.
The most widespread mistake in endurance racing is attempting to hold a steady average pace across uneven terrain. Calculating a goal finishing time and dividing it evenly by the total mileage creates an unrealistic target for undulating courses.
A runner targeting an eight-minute-per-mile pace across a mountainous marathon must accept that steep climbing miles might take eleven minutes, while downhill miles might take seven minutes. Trying to force an eight-minute pace up an eight percent grade will exhaust your aerobic system early. Pacing must be governed by physiological effort, power output, or heart rate, never by unadjusted clock speed.
Athletes often examine elevation profiles in isolation, completely ignoring the meteorological conditions of the race venue. A flat course can become exceptionally difficult if the final ten miles face an unyielding headwind across open terrain.
Always cross-reference the course map with historical wind patterns and hourly weather forecasts for race day. If the second half of the course heads directly into a prevailing headwind, you must conserve energy during the early tailwind miles. Burning through your energy while running fast with a tailwind leaves you defenseless when you turn back into the resistance.
In ultra-endurance events, stationary time at aid stations is one of the biggest drivers of lost performance. Athletes carefully calculate their moving pace but fail to budget for the minutes spent searching for gear, filling hydration bladders, or choosing food.
Your course reconnaissance should establish exact tasks for every single aid station. Know precisely what you need before you enter the support zone:
Treating aid stations as logistical transition points rather than rest stops saves substantial time over an entire race.
In cycling events, inexperienced riders often view downhills solely as opportunities to coast and rest. However, if a descent is highly technical with tight, blind corners, the repeated cycle of hard braking followed by hard acceleration to regain speed places heavy demands on the anaerobic energy system.
Studying the descent profiles in advance allows you to anticipate these decelerations. Smooth cornering lines and conservative entrance speeds reduce the need for sharp, violent braking, preserving both your physical energy and mental focus.
To safeguard your body against the structural stresses of intense racing, explore our guides on injury prevention protocols.
To verify that your course reconnaissance methods are improving your race execution, track specific objective metrics across your events and key simulation workouts. Monitoring these data points over time provides clear proof that your strategy is working.
For cyclists using a power meter, Variability Index measures the smoothness of your power delivery. Variability Index is calculated by dividing your Normalized Power by your Average Power across a ride.
On rolling or hilly courses, an undisciplined rider will often produce a high Variability Index of 1.15 to 1.25, indicating excessive surging on climbs and coasting on descents. A well-executed pacing strategy based on thorough course reconnaissance typically produces a Variability Index between 1.05 and 1.08 on hilly terrain. Keeping this ratio low ensures steady glycogen utilization and prevents early muscular fatigue.
Aerobic decoupling evaluates the relationship between your physical output (power in cycling, speed in running) and your internal physiological response (heart rate) across the duration of an event. In a well-paced race, the ratio of output to heart rate should remain relatively stable during the first and second half of the effort.
If your heart rate drifts upward significantly while your power or speed remains flat (or your speed drops while your heart rate stays high), your aerobic decoupling exceeds five percent. This decoupling indicates progressive dehydration, heat stress, or late-race muscular fatigue often caused by aggressive early pacing on climbs. Tracking this metric helps you refine your effort caps for future events.
Runners equipped with GPS watches and analytical platforms can review their Gradient-Adjusted Pace post-race. Gradient-Adjusted Pace estimates the equivalent pace you would be running on flat ground at your current energetic output.
A steady, disciplined race execution on a hilly course will show a remarkably stable Gradient-Adjusted Pace line, even while your actual speed swings dramatically between uphills and downhills. Large spikes in your adjusted pace on uphill sections reveal moments where you pushed beyond your target metabolic limits.
Use this concise operational checklist during race week to convert your route reconnaissance into an organized, stress-free execution plan.

Follow ReEndure for practical insights on endurance training, recovery, nutrition and healthy aging. Stay connected for new articles, research led guidance and ideas to help you perform better for longer.


Read practical ideas on endurance training, recovery, nutrition and healthy aging to keep progressing for years to come.
Read the Blog