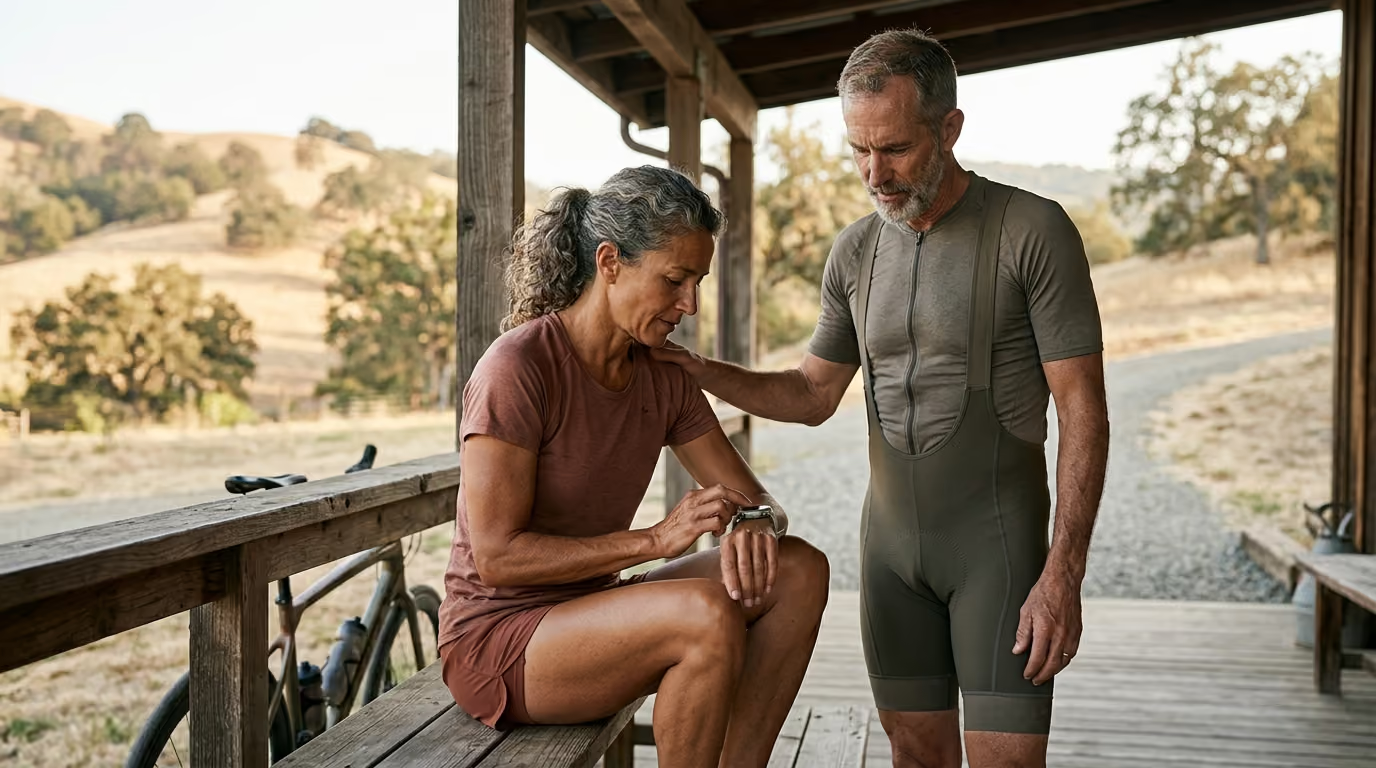

Accurate training adjustments become second nature when combining objective HRV and resting heart rate data with subjective sleep and recovery ratings.





Athletic readiness monitoring is not an automated score that dictates whether you can lace up your shoes. It is a systematic process of gathering independent physiological, behavioral, and subjective data points to assess how your body handles total stress. A high readiness number on a wearable device does not guarantee a personal record. A low score does not mean you are confined to the couch.
When athletes treat single metrics as absolute verdicts, they fall into predictable traps. They cancel key interval sessions because of minor sensor noise, or they push through severe systemic fatigue because an algorithm gave them a green light. Real physiological readiness is a converging-signal problem.
To make sound decisions, you need to understand how each recovery variable operates. You must recognize the strengths and technical limitations of heart-rate variability, resting heart rate, sleep metrics, and perceived exertion. By synthesizing these signals into a unified framework, you can make intelligent training adjustments that protect your longevity and athletic progress.
Every endurance athlete knows the feeling of waking up to conflicting information. Your alarm goes off after eight hours in bed, but your legs feel heavy and flat. You check your wrist, and your wearable proclaims that you are primed for peak performance. You head out for a planned tempo run, only to find that your heart rate spikes five beats higher than usual at an easy pace.
In our experience working with master endurance athletes, this disconnect causes immense frustration. Athletes find themselves caught between trusting their technology and trusting their physical sensations. When metrics contradict physical sensations, athletes often pick the wrong signal to follow.
Readiness is not a single number because human physiology does not fatigue in a uniform line. Your central nervous system, muscular structure, metabolic pathways, and psychological state recover at different rates. Heart-rate variability, resting heart rate, sleep duration, perceived recovery, and session exertion each capture distinct physiological domains.
The objective of modern athlete monitoring is not to find one flawless metric. The goal is to determine whether multiple independent signals point in the same direction. When several variables align, your decision confidence rises. When signals disagree, you must evaluate context before making drastic changes to your training plan.
Athletes who review our structured recovery resources quickly learn that training stress interacts with life stress, sleep quality, and nutritional status. Isolating one metric from this broader ecosystem leads to poor decisions. A converging-signal framework protects you from overreacting to daily measurement noise while ensuring you recognize genuine systemic fatigue.
Heart-rate variability, or HRV, measures the tiny variations in time between consecutive heartbeats. These fluctuations are measured in milliseconds and reflect the continuous tug-of-war within your autonomic nervous system. The autonomic nervous system consists of two primary branches: the sympathetic branch, which drives your fight-or-flight response, and the parasympathetic branch, which governs rest and digestion.
In sports science and athlete monitoring, vagally mediated HRV is most commonly quantified using RMSSD, which stands for the root mean square of successive differences between normal heartbeats. Researchers frequently use the natural logarithm of this value, known as lnRMSSD. Transforming the data with a natural log reduces statistical skew, creating a more balanced distribution for daily tracking.
A high vagally mediated HRV generally indicates robust parasympathetic activity, suggesting that your body is adapting well to current stress. A depressed HRV often reflects dominant sympathetic activity, signaling systemic fatigue, emotional stress, or poor recovery. However, research demonstrates that this relationship is not universal. A 2025 scoping review in Sleep Advances highlighted that while higher vagally mediated HRV often correlates with better sleep and lower stress, individual responses vary substantially across different measurement tools and athletic populations.
One of the most frequent errors in endurance sports is comparing your raw HRV score to that of another athlete. Absolute HRV values are heavily influenced by genetics, age, baseline cardiovascular fitness, and technical measurement methods. A raw RMSSD of 40 milliseconds may represent a peak recovery day for a veteran marathoner, while representing severe exhaustion for a collegiate runner.
To use HRV effectively, you must track baseline-relative values. You establish a rolling baseline over several weeks to understand your personal normal range. Daily readings are then evaluated based on whether they fall within or outside this individual window.
A systematic review published in the International Journal of Sports Physiology and Performance examined athlete HRV measurement protocols across 11 studies. The researchers found that the coefficient of variation for lnRMSSD ranged from 1.80% to 61.0% depending on the protocol used. This massive spread proves that standardized measurement is mandatory. Without strict consistency in timing, posture, and breathing, daily absolute numbers are practically meaningless.
Resting heart rate, or RHR, serves as a broad, reliable measure of basal cardiovascular state. While HRV assesses the autonomic timing between beats, RHR simply measures how many times your heart beats per minute at complete rest. It is a simple metric, but it provides crucial context when paired with HRV.
Your resting heart rate responds to training volume, environmental heat, hydration status, altitude, and psychological stress. A higher-than-usual resting heart rate paired with a lower-than-usual HRV presents a strong physiological signal of accumulated systemic stress. Conversely, an elevated resting heart rate alongside a normal HRV and high subjective energy may simply reflect a late dinner or a warm bedroom.
A research review on monitoring athletic readiness recommends tracking rolling weekly averages of both metrics. Using at least three or four measurements per week allows you to smooth out daily fluctuations. Expressing these changes through a weekly coefficient of variation provides a clear picture of true cardiovascular adaptation.
Sleep is the foundational pillar of athletic recovery. During sleep, your body repairs damaged muscle fibers, balances hormones, and restores neurological function. Modern consumer devices make tracking sleep effortless, but athletes must understand what these devices can and cannot accurately measure.
To evaluate sleep data properly, you must separate sleep into distinct components. These include sleep opportunity, sleep duration, sleep continuity, sleep timing, and subjective sleep quality. Sleep opportunity refers to the total time you spend in bed, while duration measures the actual time spent asleep. Sleep continuity tracks how often you wake up, and sleep timing reflects your schedule consistency.
Many athletes obsess over the sleep-stage graphs generated by their smartwatches. They wake up anxious because their app reported only 40 minutes of deep sleep or an apparent deficit in rapid eye movement sleep. Sports science research reveals that this level of anxiety is entirely unwarranted.
Validation studies comparing consumer wearables against polysomnography, the laboratory gold standard for sleep measurement, show a stark difference in accuracy across metrics. A review of wearable sleep-staging literature reported that consumer devices achieve an average accuracy of 87.2% for broad sleep-versus-wake detection. However, accuracy drops to 69.7% for three-stage classification and 65.2% for four-stage classification.
A 2024 consensus review in Sleep Medicine Reviews reported that consumer device accuracy varies between 50% and 90% for light sleep, and between 30% and 80% for deep and REM sleep. These algorithms rely primarily on movement, optical pulse data, and skin temperature. They cannot read brainwaves.
Consequently, you should never make major training modifications based solely on an estimated deep-sleep score. The most valuable use of wearable sleep data is tracking broad behavioral trends. Look for patterns such as a shrinking sleep opportunity, highly erratic bedtimes, or frequent nighttime awakenings.
Subjective sleep quality describes how restorative your sleep felt upon waking. A systematic review examining sleep and HRV in athletic populations found that subjective sleep quality often had a stronger association with autonomic markers than device-estimated sleep stages did.
If your device claims you had poor sleep architecture, but you wake up refreshed, alert, and energized, trust your physical state. Conversely, if your watch shows eight hours of perfect rest, but you wake up groggy and physically unrefreshed, your recovery may still be compromised. Subjective perception captures subtle physiological disturbances that wrist sensors easily miss.
In an era dominated by digital sensors, athletes often dismiss their internal sensations as soft or unscientific data. This is a profound mistake. Subjective monitoring tools, such as the Perceived Recovery Status scale, provide rigorous, repeatable, and highly actionable information that objective sensors cannot capture.
The Perceived Recovery Status scale asks athletes to rate their recovery on a standardized numerical scale before training. This self-assessment integrates muscle soreness, joint stiffness, mental energy, emotional stress, and personal confidence into a single rating. It captures localized muscular fatigue and cognitive burnout long before these issues register on a cardiovascular sensor.
A foundational study published in the Journal of Strength and Conditioning Research investigated the Perceived Recovery Status scale during repeated-sprint protocols. The researchers found a moderate negative correlation of r = -0.63 between perceived recovery scores and changes in sprint performance. When athletes reported low perceived recovery, their performance suffered predictably under identical physical conditions.
A 2026 sports science study examining high-intensity interval exercise reported an intraclass correlation coefficient of 0.934 for the Perceived Recovery Status scale. This demonstrates exceptional test-retest reliability. The study also found strong correlations between lower recovery ratings, elevated pain scores, and reduced countermovement jump heights.
Perceived recovery often serves as an early warning system for overreaching. In a study tracking athletes through an intensified training block, researchers found that subjective recovery scores deteriorated significantly before any systematic changes appeared in wearable sleep or nocturnal cardiovascular metrics.
Your brain continuously processes feedback from muscle receptors, inflammatory cytokines, and energy stores. When your muscles are depleted or experiencing microtrauma, you perceive this as heavy legs, lack of motivation, or low readiness. If you ignore these signals simply because your watch displays a normal HRV, you increase your risk of chronic overuse injury.
To make subjective readiness actionable, you must pair pre-session ratings with post-session exertion. Rating of perceived exertion, or RPE, measures how physically and mentally demanding a workout felt. Multiplying your session RPE by the duration of the workout in minutes provides an accurate metric of internal training load.
Research in team-sport athletes shows that session-RPE training loads correlate strongly with heart-rate-based training loads, with correlation coefficients ranging from R = 0.73 to R = 0.76. This method captures the true biological cost of a session. If a routine easy aerobic run feels like an all-out tempo effort, your internal load was far higher than planned. Tracking this disconnect allows you to catch under-recovery before it derails your entire training block.
Because no individual metric tells the whole story, you must analyze how these variables behave together. When metrics agree, your path forward is clear. When they diverge, the specific pattern of divergence reveals what kind of stress your body is facing.
Understanding these interactions helps you apply core training and performance principles without second-guessing your plan. Below are the primary combinations you will encounter during training.
This is the classic presentation of acute systemic stress. Your parasympathetic system is suppressed, and your basal cardiovascular system is working overtime.
This combination frequently occurs after exceptionally long endurance sessions, heavy interval blocks, or when your body is fighting off an infection. It also appears during periods of severe psychological stress, significant sleep deficits, or prolonged caloric restriction. When both metrics shift together, systemic fatigue is real, and training load should be modified.
In this scenario, your autonomic nervous system has normalized, but your muscular or cognitive systems remain fatigued.
This pattern is exceptionally common after heavy strength training, downhill running, or multi-day volume blocks. Your heart rate response may look stable, but your muscles lack glycogen or suffer from structural damage. Trust your subjective score here. Attempting a maximal intensity session in this state often leads to poor mechanics and acute strains.
This divergence often causes confusion. Your HRV dips outside your normal baseline, yet you feel energetic, and your resting heart rate is completely steady.
This isolated dip often reflects an acute, transient variable rather than chronic exhaustion. A late meal, a single glass of wine, minor dehydration, or a slightly warm room can suppress nighttime HRV without impairing functional muscular capacity. You do not need to cancel your session. Proceed with your planned workout, but pay attention to your warm-up sensations.
Athletes often assume that higher HRV is always better. In rare cases, an unusually large spike in HRV accompanied by heavy lethargy and sluggish performance can indicate parasympathetic overreaching.
In this state, the autonomic nervous system enters a state of exhaustion where the parasympathetic system over-dominates. If your HRV is dramatically higher than your baseline, but your legs feel dead and you struggle to raise your heart rate during exercise, your body needs restorative rest.
To make recovery metrics useful, you must establish an accurate baseline. Population averages published on the internet are useless for individual programming. You must determine what is normal for your unique physiology under standardized conditions.
Standardization is the foundation of baseline tracking. A review of athletic monitoring protocols highlighted that small methodological variations create substantial measurement error. To build a reliable baseline, adhere strictly to the following collection rules:
If you rely on nocturnal wearable tracking, ensure your device fits snugly in the same position on your wrist each night to minimize motion artifacts.
Do not compare today's score only to yesterday's score. Human physiology naturally fluctuates from day to day. A single low reading is often just biological noise.
Calculate a seven-day rolling average for your lnRMSSD and resting heart rate. Next, establish a normal range around this average, typically set at 0.5 to 1.0 standard deviations from your mean. This window represents your smallest worthwhile change. As long as your daily readings fluctuate within this band, your autonomic nervous system is operating within its expected physiological parameters.
A study of elite athletes published in the Journal of Sports Sciences demonstrated that individual smallest worthwhile changes for lnRMSSD varied from 2.42% to 9.44% across different training groups. This variation proves why generic percentage cutoffs fail. Your personal baseline defines what constitutes a meaningful physiological shift.
Once you have established your baseline and understand metric interactions, you can implement a practical decision framework. A four-level traffic-light system allows you to adjust workouts objectively without emotional second-guessing.
All primary signals are normal. Your HRV and resting heart rate sit comfortably within your seven-day baseline window. Your sleep was sufficient, your perceived recovery rating is high, and your muscle soreness is minimal.
Training Action: Execute your planned workout without modification. You have the physiological and subjective capacity to handle high-intensity intervals, long tempo blocks, or maximal strength work.
A single metric is mildly outside your normal range. Your HRV is slightly depressed, or your resting heart rate is elevated by a few beats, but your subjective readiness and sleep quality remain solid. Alternatively, your metrics are green, but you feel slight muscular tightness.
Training Action: Begin your scheduled session, but use an extended, progressive warm-up. Pay close attention to how your body responds during the first 15 minutes. If your heart rate stabilizes and your perceived effort feels normal for the prescribed pace, complete the session as planned. If the warm-up feels unusually difficult, reduce the total volume by cutting the final set of intervals.
Multiple independent signals point to moderate fatigue. Your HRV is depressed below your baseline threshold, your resting heart rate is elevated, and you report poor subjective sleep and elevated muscle soreness.
Training Action: Modify the session to reduce neurological and cardiovascular strain. Replace high-intensity anaerobic work with steady Zone 2 aerobic running or cycling. Keep the duration moderate, and avoid training to muscular failure. This allows you to accumulate aerobic volume without overloading your recovering autonomic system.
Every signal indicates profound fatigue or systemic disturbance. Your HRV is significantly depressed for consecutive days, resting heart rate is sharply elevated, perceived recovery is very low, and you feel mentally drained or show signs of illness.
Training Action: Cancel the workout entirely. Prioritize passive rest, light mobility work, nutrient-dense meals, and early sleep. Investigate non-training stressors, such as work deadlines, nutritional deficits, or impending infections. Do not return to high-intensity training until your subjective scores and baseline metrics show clear stabilization.
As endurance athletes pass the age of 40 and 50, recovery dynamics shift. Understanding these age-related physiological changes is essential for maintaining longevity and high performance.
Autonomic flexibility naturally declines with age. Absolute HRV values tend to decrease over the decades, while basal resting heart rates may remain relatively stable. If you compare your raw HRV numbers to those of a 25-year-old training partner, your scores will look suppressed. However, this natural reduction in raw amplitude does not mean you cannot adapt to hard training. It simply emphasizes why baseline-relative tracking is essential for healthy athletic aging.
Older athletes also experience alterations in sleep architecture. Research indicates that the percentage of deep slow-wave sleep naturally decreases with age, while nighttime awakenings become more frequent. If you rely on a wearable device that penalizes your readiness score for minor sleep disruptions, you may find yourself perpetually stuck in an artificial red zone. Focus on sleep consistency and how energized you feel throughout the day rather than chasing flawless sleep scores.
Furthermore, connective tissue turnover and muscular protein synthesis slow down over time. An older athlete may show a fully recovered cardiovascular and autonomic system on their watch, while their tendons, ligaments, and muscle fibers still carry structural fatigue.
When my Achilles flared up right before a major marathon build, the standard advice was total rest. But diving into the clinical research on tendon loading changed my approach entirely. I swapped complete rest for heavy slow resistance training, specifically utilizing heavy calf raises on a deficit. It felt counterintuitive to load an injured tendon, but the science was clear. Within six weeks, the morning stiffness faded, and I was back to building mileage without the chronic ache.
This experience taught our team a permanent lesson. Cardiovascular metrics alone do not reflect tissue tolerance. Master athletes must weigh localized musculoskeletal feedback just as heavily as autonomic metrics when making daily training decisions.
Even experienced athletes make critical errors when integrating technology into their daily routines. Recognizing these common pitfalls will save you from unnecessary training interruptions and chronic fatigue.
Athletes frequently assume that a high morning HRV guarantees a breakthrough workout. A systematic review and meta-analysis on HRV-guided endurance training found that while HRV-guided programming produced medium improvements in submaximal physiological markers, it showed only small, non-significant effects on peak performance and VO2 peak compared to predefined training.
HRV reflects systemic stress tolerance, not absolute power output or race-day speed. You can execute an exceptional race on an average HRV day if your mental focus, fueling, and biomechanics are dialed in. Never let a lower-than-average morning metric create a negative psychological expectation before a workout.
A single abnormal reading should prompt curiosity, not an immediate rewrite of your training block. Technical errors, sensor placement shifts, minor sleep disruptions, or late-night digestion can cause a single-day metric drop.
Always look for persistence across multiple days. A true physiological disturbance shows up as a consistent trend over 48 to 72 hours. Reacting to every single daily blip creates erratic, inconsistent training.
Many commercial wearables combine HRV, sleep, skin temperature, and past activity into a single proprietary readiness score. These algorithms are trade secrets and vary wildly between manufacturers.
When you evaluate a proprietary score, you cannot see which specific physiological variable triggered a red or green rating. An athlete might receive a terrible readiness score simply because their sleep duration was short, even though their autonomic and muscular systems are fully recovered. Always look past the composite score and examine the raw individual components: resting heart rate, baseline-relative HRV, total sleep time, and subjective feeling.
Your autonomic nervous system cannot distinguish between the stress of an 800-meter track repeat, a heated workplace argument, or a 500-calorie dietary deficit. Research confirms that psychological distress and inadequate caloric intake directly suppress vagally mediated HRV.
If your recovery metrics are consistently depressed despite moderate physical training, look outside your workout log. Under-fueling, job strain, relationship stress, and travel fatigue all draw from the exact same systemic recovery reserve. Adjust your training load when total life stress peaks.
Daily monitoring tells you what to do today. Long-term trend analysis tells you whether your overall training program is actually working. By observing how your baseline metrics evolve over weeks and months, you can confirm whether you are building fitness or heading toward overtraining.
Evaluating recovery metrics alongside performance markers provides objective proof of physiological adaptation. Reviewing your hardware data using reliable monitoring gear and technology allows you to spot broader functional trends.
When an endurance block is structured effectively, you will observe a clear long-term physiological pattern over an eight to twelve-week period:
This pattern demonstrates increased stroke volume, enhanced parasympathetic tone, and superior metabolic efficiency. Your body is successfully absorbing and adapting to the training load.
If your training load exceeds your recovery capacity over several consecutive weeks, your long-term trends will show clear warning signs:
When this pattern appears across several weeks, taking a single rest day will not resolve the issue. You must schedule a dedicated deload week, reduce training intensity by at least 50%, and address systemic recovery variables.
An unusually high HRV paired with heavy physical fatigue often indicates parasympathetic hyperactivity, a known marker of autonomic overreaching. In this state, your nervous system suppresses sympathetic activation to protect itself from further exhaustion. If your HRV is well above your normal baseline, but your legs feel dead and you cannot elevate your heart rate during exercise, prioritize rest.
No. Consumer sleep scores rely heavily on proprietary algorithms and inaccurate sleep-stage estimations. If your total sleep duration was reasonable and your subjective recovery feels good, proceed with your workout. Use your warm-up to gauge true readiness rather than canceling a session based on an arbitrary sleep score.
Both methods are valid when performed consistently. Morning readings taken with a chest strap provide a highly controlled, standardized snapshot of autonomic function under waking conditions. Overnight wearable tracking captures a continuous average throughout the night, reducing the impact of acute morning movement. The key is to pick one consistent method and stick with it rather than switching between devices.
Following a major endurance event, autonomic and muscular markers can remain disturbed for two to three weeks. In the first 48 to 72 hours, HRV is typically suppressed and resting heart rate is elevated. Even after morning HRV numbers return to baseline, localized muscular damage and structural inflammation can persist for several more weeks. Always prioritize perceived soreness and structural healing over cardiovascular metrics when returning to running after a race.

Follow ReEndure for practical insights on endurance training, recovery, nutrition and healthy aging. Stay connected for new articles, research led guidance and ideas to help you perform better for longer.


Read practical ideas on endurance training, recovery, nutrition and healthy aging to keep progressing for years to come.
Read the Blog