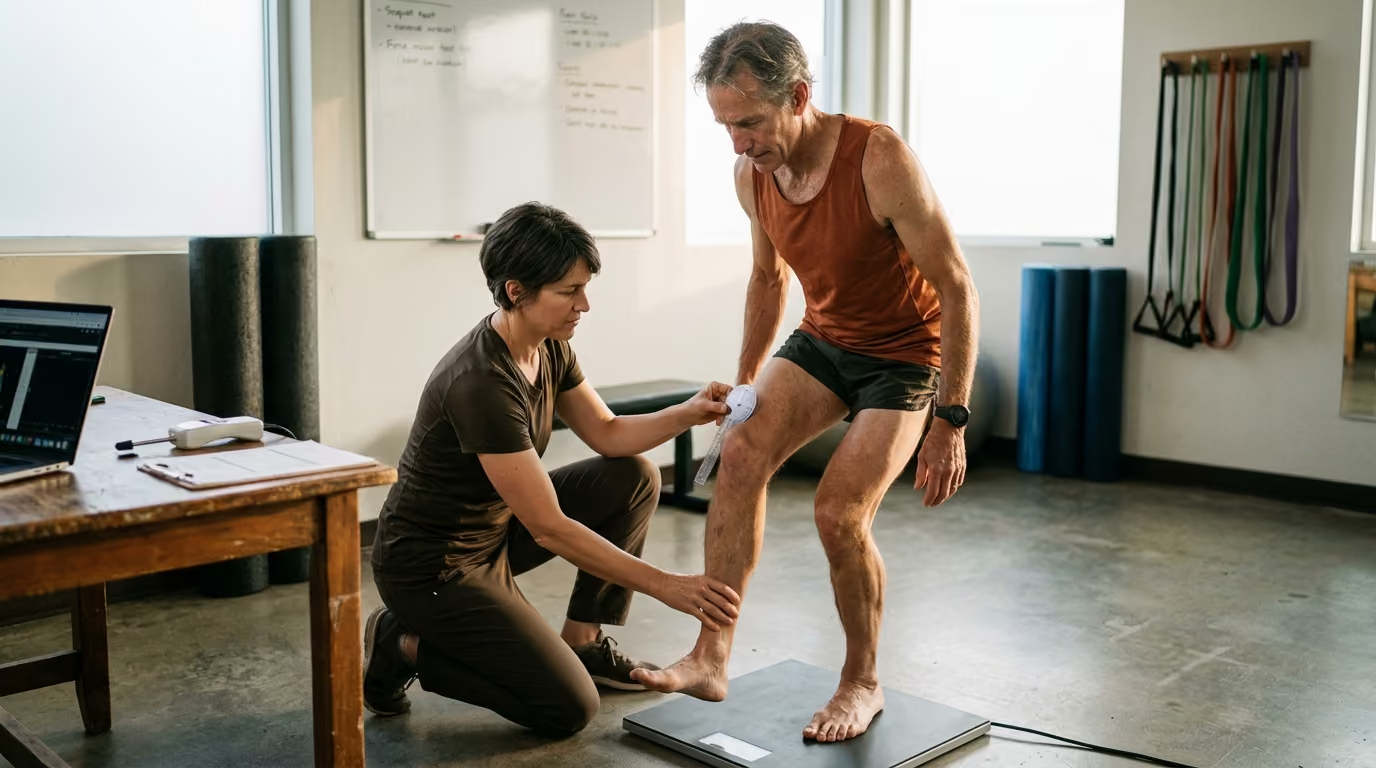

Athletes often view movement screens as predictive guarantees, yet their real scientific value lies in tracking tissue capacity and training readiness.





Passing an injury risk screen does not guarantee you will stay healthy during your next marathon or triathlon build. In fact, relying on a single test score to predict your physical durability is one of the most misleading habits in modern endurance sports.
Many athletes assume that a sports medicine clinic or a movement screen can pinpoint their exact injury risk before the season starts. You might spend an hour performing deep overhead squats, balancing on single legs, and getting your joint angles measured with a goniometer. If you receive a clean score, you feel protected. If you receive a low score, you might spend weeks doing corrective drills instead of building your aerobic base.
Both reactions are fundamentally flawed. The human body under endurance training is a dynamic biological system, not a static machine that can be certified with a simple inspection. To build genuine resilience over decades of training, you must understand what screening can actually identify, what it completely misses, and how to use physical assessments as clinical decision support rather than a crystal ball.
Consider the typical experience of an ambitious master marathoner preparing for a peak race block. Before ramping up mileage, the runner books an assessment with a physical therapist. The therapist runs through a standard seven-part movement screen, measures hamstring flexibility on a treatment table, and checks hip abductor strength with a handheld dynamometer. The athlete scores in the top tier across every metric, receives clearance, and leaves feeling invulnerable.
Four weeks later, the athlete adds fifteen miles of weekly volume and introduces weekly track intervals. By week six, a sharp ache develops along the medial tibia, eventually diagnosed as a bone stress injury. The runner is confused and frustrated. How could someone who aced every flexibility, balance, and strength test end up on crutches just two months later?
The reverse scenario happens just as frequently. A veteran cyclist or trail runner might fail a standardized movement screen due to stiff ankles or asymmetric hip rotation. Despite the low score, this athlete might log six hundred hours of training over the year without missing a single workout to injury.
These common situations highlight the central reality of sports medicine. A physical screen provides a brief snapshot of your body under unloaded, resting conditions. It does not measure how your bones, tendons, and neuromuscular system respond to hundreds of thousands of repetitive foot strikes under profound metabolic fatigue. When we treat screening as a predictive pass or fail exam, we misinterpret the science of musculoskeletal health. You can review our broader collection of targeted injury prevention resources to see how screening fits into a wider durability strategy.
To understand why injury prediction is so difficult, we must look at how sports injuries are defined and studied. The International Olympic Committee defines a sports injury as tissue damage or another derangement of normal physical function resulting from the transfer of kinetic energy during sports participation. In endurance athletics, these problems rarely occur because of a single catastrophic collision. They develop through gradual loading, where repetitive mechanical strain outpaces the remodeling capacity of tendons, bones, and muscles.
Research shows that injury rates vary wildly depending on athlete experience and exposure. A systematic review on running injuries found a weighted incidence of 17.8 injuries per 1,000 hours in novice runners and 7.7 injuries per 1,000 hours in recreational runners. Across broader cohorts, overall injury incidence sits around 40.2 percent, with a point prevalence near 44.6 percent. Because so many runners experience tissue soreness, researchers must distinguish between harmless adaptation and functional breakdown.
A fundamental mathematical problem prevents any single test from predicting injuries accurately. Even if a screening test has acceptable laboratory accuracy, modest injury base rates generate substantial numbers of false positives and false negatives.
In a prospective study evaluating the Functional Movement Screen, researchers found that a cutoff score of 13 produced a sensitivity of 48.1 percent and a specificity of 62.4 percent. The positive predictive value was only 50.7 percent, while the negative predictive value was 60.0 percent. This means the test performed only slightly better than a coin flip when trying to categorize which specific individuals would get hurt.
When sports scientists analyze predictive models across all athletic disciplines, the results are equally sobering. A comprehensive systematic review examined sports injury prediction models and found that 98 percent of published models carried a high or unclear risk of bias. The authors concluded that no single prediction model could currently be recommended for clinical practice.
Practitioners frequently confuse statistical association with direct causation. A study might show that athletes who score poorly on a test suffer more injuries as a group. However, that statistical correlation does not mean the poor score caused the injury.
A low score often reflects the lingering consequences of an old injury, such as joint guarding, pain inhibition, or loss of confidence. If that athlete breaks down again, the screening test merely detected the residual deficit of the previous injury. Furthermore, many risk factors are non-modifiable, such as chronological age, biological sex, or anatomical architecture. A true risk factor must be modifiable and causally linked to tissue stress before targeted intervention can lower your injury probability.
A single pre-season screen is nothing more than an isolated data point. In contrast, surveillance is the continuous, repeated tracking of training exposure, physical symptoms, and functional readiness over time.
The International Olympic Committee load consensus recommends continuous surveillance over static screening. Instead of relying on a pre-season test, endurance athletes should track weekly training hours, vertical gain, intensity distribution, and acute load spikes. They should also monitor sleep quality, general fatigue, and localized tissue soreness. Continuous surveillance catches the early warning signs of overload before tissue failure occurs.
Strength testing is widely promoted as a cornerstone of injury prevention for runners, cyclists, and triathletes. Evaluating how much force a muscle group can generate provides valuable insight into athletic capacity. However, the way strength is assessed often fails to reflect the true physiological demands of endurance sports.
Clinical strength testing typically evaluates specific parameters across isolated muscle groups:
For an endurance athlete, maximal force production is rarely the limiting factor in overuse injuries. The more relevant question is whether a specific muscle group can tolerate repetitive contractions over thousands of cycles while maintaining joint stability.
The scientific literature on strength screening presents surprising contradictions. A systematic review examining strength, flexibility, range of motion, and alignment in runners found very few consistent associations with future injury. In fact, one study within the review noted an association between higher hip abductor strength and increased injury rates, likely because stronger runners pushed higher training volumes.
In another prospective investigation tracking runners over an entire training cycle, baseline strength measures, joint mobility, and spatiotemporal gait parameters were not predictive of injury. These findings do not suggest that strength is unimportant. They demonstrate that having strong muscles does not protect you if your training volume increases faster than your connective tissues can adapt.
Strength testing is most valuable when tailored to specific anatomical areas vulnerable to endurance stress:
Interpret these tests as baseline capacity indicators rather than injury forecasts. If you identify a major deficit or symptom reproduction during a test, use targeted resistance training to build capacity. You can explore structured routines in our recovery and mobility guides to support tissue health.
Movement screens use standardized, multi-joint tasks to observe coordination, balance, joint mobility, and dynamic control. The most widely recognized system is the Functional Movement Screen, which evaluates seven distinct movement patterns on a scale from zero to three.
The Functional Movement Screen demonstrates good interrater and intrarater reliability, with intraclass correlation coefficients hovering around 0.81. This means different clinicians can score the same athlete consistently. However, reliability does not equal predictive validity.
A systematic review published in the sports medicine literature concluded that Functional Movement Screen composite scores have small or inconsistent associations with future injury. In collegiate athletic populations, composite scores failed to provide discriminatory prediction of overall musculoskeletal injury or severe tissue damage. A meta-analysis examining military personnel found a pooled risk ratio of 1.47 for scores of 14 or below, but the authors concluded this association was too weak to justify using the screen as an injury prediction tool.
A low composite score often aggregates irrelevant findings while masking a critical local deficit. For example, an athlete might score poorly due to tight shoulders while having exceptional lower-body mechanics. Conversely, an athlete could achieve an acceptable score of 15 while experiencing subtle knee pain during the in-line lunge.
Clinicians frequently use the single-leg squat or step-down test to evaluate dynamic knee valgus, assuming that medial knee collapse during a clinical test predicts knee collapse during running. Research challenges this direct transfer.
One clinical study investigated runners with patellofemoral pain syndrome and found that performance on a single-leg squat could not predict the magnitude of dynamic knee valgus measured during high-speed running. A slow, unloaded single-leg squat in a quiet room does not replicate the elastic loading, ground reaction forces, and neuromuscular fatigue of outdoor running.
Movement screening should not be used to restrict an asymptomatic athlete from normal training. Instead, apply movement observation through these constructive steps:
Endurance athletes have long believed that greater flexibility directly reduces injury risk. Runners spend extensive time stretching their hamstrings, while cyclists stretch their hip flexors to counteract aggressive riding postures. However, scientific investigations tell a very different story regarding passive range of motion.
Prospective studies examining distance runners repeatedly show that static flexibility is not strongly associated with injury rates. A systematic review tracking joint mobility and musculoskeletal injuries found only isolated, conflicting correlations. Increased hip internal rotation was protective in one cohort, while decreased rotation was protective in another.
Distance running requires relatively small joint ranges of motion compared to gymnastics, swimming, or martial arts. In fact, moderate passive stiffness in the Achilles tendon and plantar fascia improves elastic energy return, acting like a tight spring that enhances running economy. Stretching these tissues to achieve extreme passive range of motion can actually diminish running efficiency without lowering injury risk.
The critical distinction in sports medicine is between passive flexibility and active, usable range of motion under load. Passive flexibility is the distance a joint can be moved by an external force while your muscles remain relaxed. Active range of motion is the joint arc you can actively control with muscular tension.
Consider these primary mobility targets for endurance performance:
If you discover a restriction in these active ranges, address it through loaded mobility and dynamic movement rather than passive static stretching.
Balance and postural control are vital for endurance athletes who navigate uneven trails, slippery pavement, or crowded race courses. A failure in neuromuscular coordination can lead to acute ankle sprains, knee twists, or chronic overloading from unstable mechanics.
The most researched clinical balance tool is the Y-Balance Test Lower Quarter, derived from the Star Excursion Balance Test. The athlete stands on one leg and reaches the opposite foot as far as possible in three directions: anterior, posteromedial, and posterolateral. The reach distances are measured, normalized to leg length, and compared between limbs.
A systematic review on the Y-Balance Test confirmed that the protocol has strong test-retest reliability. However, the review found that universal cutoff scores cannot predict lower-extremity injury across different athletic populations. Cutoff points must be interpreted strictly within specific sports, age brackets, and competitive levels.
In collegiate athletic cohorts, composite Y-Balance scores failed to predict injury risk. Some individual studies have identified specific risk thresholds in niche groups. For example, one study in Division I athletes found that an anterior reach asymmetry greater than 4 centimeters showed 59 percent sensitivity and 72 percent specificity for non-contact injury. However, transferring that single cutoff point to a 50-year-old marathoner or master road cyclist is clinically invalid.
Balance performance fluctuates based on several transient variables:
Use balance assessments primarily to track functional recovery following lower-limb trauma or to evaluate trail-running readiness:
While physical screens provide interesting laboratory data, an athlete's training history provides the most accurate indicators of injury vulnerability. Musculoskeletal tissue fails when applied physical stress exceeds current biological capacity. Therefore, auditing external workload patterns is vastly more actionable than measuring isolated joint angles.
Across every major epidemiological study in sports medicine, the single strongest risk factor for future injury is a previous injury to the same anatomical site. A one-year prospective cohort study of recreational runners found a cumulative injury incidence of 45.9 percent. Runners who reported a previous injury within the past year had a hazard-rate ratio of 1.9 compared to runners with no prior injury history. In practical terms, having a previous injury roughly doubles your statistical risk of breaking down again.
A prior injury leaves behind subtle structural alterations, including reduced tendon compliance, altered motor recruitment patterns, and scar tissue remodeling. When training volume surges, these previously injured tissues are the first to experience symptomatic overload.
Understanding where injuries occur helps focus your monitoring efforts. A comprehensive systematic review pooling data from 23 prospective studies showed that 26.2 percent of endurance runners sustained an injury during the study periods. The anatomical distribution was heavily concentrated in three key regions:
Injury rates also scaled directly with competitive intensity. Injury proportions were 14.9 percent in novice runners, 26.1 percent in recreational runners, and 62.6 percent in elite competitive runners. As training volume and speed increase, the mechanical demands on biological tissues rise exponentially.
When conducting a training history audit, systematically review these external variables from the preceding eight to twelve weeks:
You can learn more about structuring sustainable workloads by reviewing our training and performance planning resources.
Because no single test provides definitive prediction, the most effective approach is a layered, multi-domain screening framework. This model integrates history, symptom screening, functional capacity testing, and ongoing surveillance into an actionable decision-making protocol.
Begin every evaluation by asking specific diagnostic questions:
Before performing any fitness or capacity testing, screen for symptoms that require immediate medical evaluation rather than training modifications:
Match your physical testing battery to the specific mechanical demands of your sport:
Document your exact test scores, repetitions, reach distances, and pain levels in a training log. Standardize the testing environment by performing assessments at the same time of day and under similar fatigue states. Re-test these baseline metrics every eight to twelve weeks or after recovering from an illness or training interruption.
Every screening outcome should lead to a clear, pre-determined training action:
Athletes over age 40 face unique physiological shifts that alter injury risk patterns and change how screening data must be interpreted. As we age, our connective tissues lose water content, tendon compliance decreases, and muscle protein synthesis slows down. Understanding these biological realities allows masters athletes to screen more effectively.
With advancing age, tendons undergo structural cross-linking and a decline in proteoglycan content. While tendon stiffness can maintain force transmission, it reduces the tissue's ability to absorb sudden mechanical shocks.
Masters runners are significantly more prone to Achilles tendinopathy, plantar fasciopathy, and hamstring origin strains than their younger peers. When screening athletes over 40, prioritize calf endurance, plantar fascia sensitivity, and eccentric hamstring tolerance over passive flexibility tests. For an in-depth look at staying competitive through midlife, explore our healthy aging resources.
In younger athletes, connective tissue turnover following a hard workout occurs within 24 to 48 hours. In master athletes, this collagen remodeling cycle can take 72 hours or longer.
A screening battery for an older athlete must evaluate how well tissues recover between hard sessions. If a 50-year-old athlete demonstrates acceptable strength on Monday but experiences persistent tendon stiffness on Wednesday morning, the training density is too high. Screening must account for recovery rates rather than raw physical strength alone.
Natural age-related muscle loss, known as sarcopenia, preferentially targets Type II fast-twitch muscle fibers. These fibers are essential for rapid stabilizing contractions during trail running, cornering on a bike, or surging up hills.
Screening for athletes over 40 should include dynamic hop testing and single-leg stability tests to evaluate fast-twitch neuromuscular recruitment. Incorporating heavy, slow resistance training preserves these motor units and provides the structural stability needed for continuous endurance training.
When implementing injury risk screening into an athletic routine, athletes and coaches frequently fall victim to several common misconceptions. Recognizing these errors will keep your training focused on what matters most.
Human bodies are naturally asymmetric. Limb dominance, sport-specific demands, and historical adaptations create subtle differences between your right and left sides. Research shows that minor strength or reach asymmetries of less than 10 to 15 percent are common in completely healthy, uninjured athletes. Do not waste training energy trying to achieve mechanical perfection unless the asymmetry is accompanied by pain or functional limitation.
Passing a physical screen with top marks does not protect you from training errors. If an athlete with flawless mobility and balance abruptly doubles their long run distance or cuts out sleep, tissue breakdown will occur. Never use a high screening score as justification for reckless training progressions.
Spending 45 minutes every day stretching on a yoga mat does not make your tendons more durable. Passive stretching temporarily increases stretch tolerance in the nervous system but does not increase tendon cross-sectional area or improve bone mineral density. Replace excessive passive stretching with loaded resistance training that builds real tissue load capacity.
Testing your body every single day creates excessive hyper-vigilance and fear of movement, known clinically as kinesiophobia. Normal training produces minor muscle soreness and transient stiffness as part of natural physiological adaptation. Screening too frequently can cause athletes to panic over minor aches, leading to unnecessary training interruptions.
To maintain continuous musculoskeletal health, replace one-time pre-season screens with ongoing surveillance tracking. Surveillance provides real-time feedback on how your body is handling the cumulative stress of training, life, and recovery.
Track these subjective indicators every morning using a simple one-to-five scale:
Maintain a comprehensive training log that records external and internal workload variables:
By shifting your mindset from predictive screening to continuous surveillance, you can make informed, data-driven adjustments to your training before minor tissue strain becomes a season-ending injury. For more scientific breakdowns and practical guidance, consult our complete collection of evidence-based endurance resources.
Screening should never be used as a simple pass or fail test, but as a practical decision-support tool that helps you fine-tune your training load and build long-term athletic durability.

Follow ReEndure for practical insights on endurance training, recovery, nutrition and healthy aging. Stay connected for new articles, research led guidance and ideas to help you perform better for longer.


Read practical ideas on endurance training, recovery, nutrition and healthy aging to keep progressing for years to come.
Read the Blog